Portfolio
Zijing’s data science project portfolio
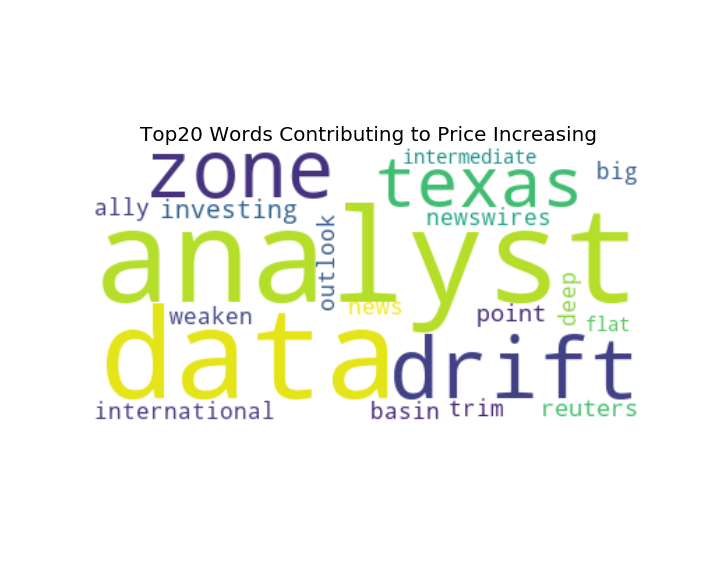
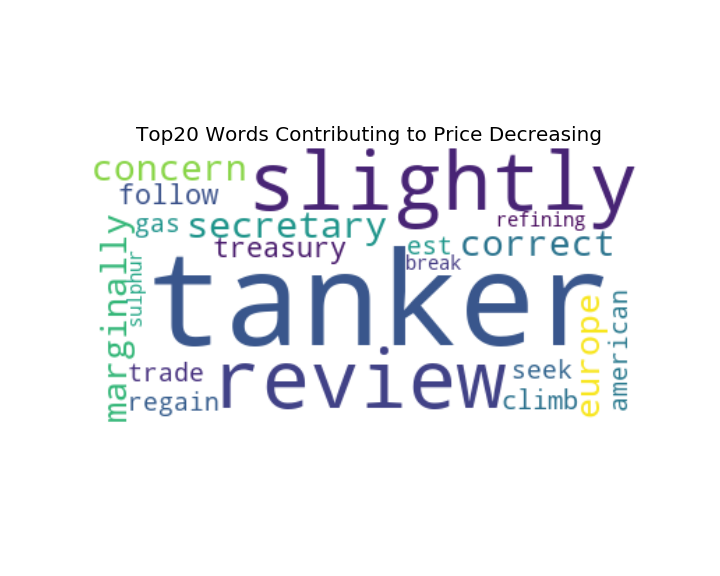
News Sentiment and Topic Analysis on WTI Crude Oil Future Prices
- Web scraped over 6000 crude-oil related news articles using URLs downloaded from Bloomberg
- Applied text mining algorithms to preprocess news articles
- Transformed cleaned text data with TFIDF Vectorizer, utilized Logistic Regression, LDA, and K-means to conduct sentiment and topic analysis
- Deployed the trained and evaluated machine learning model at Heroku as a web app
- Academic paper describing the project in detail
| Positive Words | Negative words |
|---|---|
 |
 |
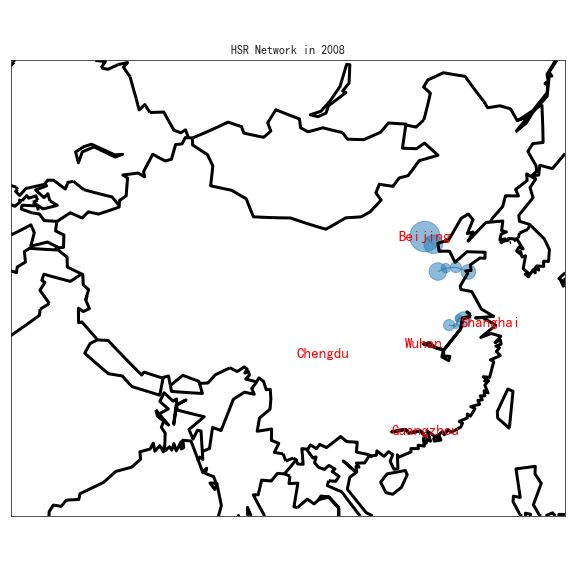
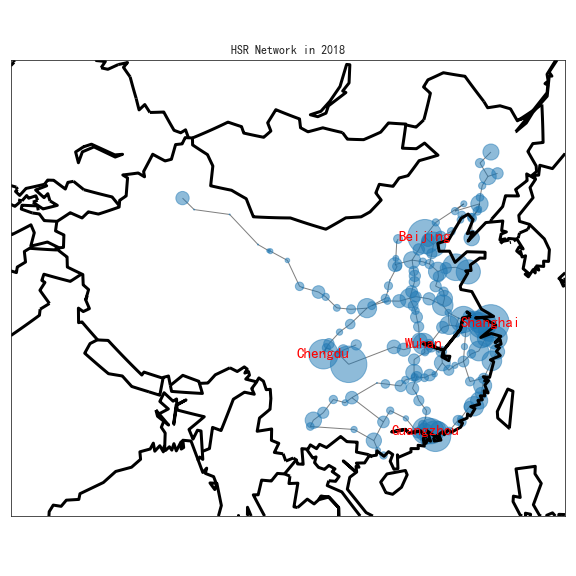
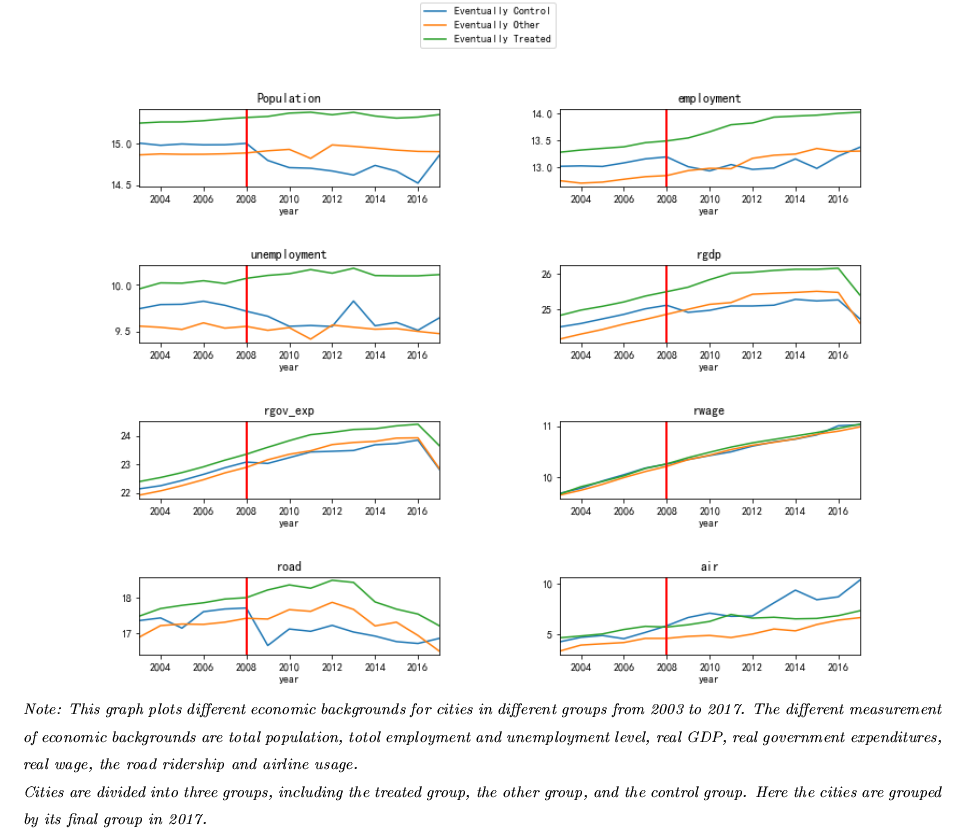
High-Speed Railway(HSR) Network Growth and Labor Reallocation
- Conducting casual inference between employment and transportation cost across cities and industries using fixed effect panel regression with R
- Constructed an instrument variable conducting spatial analysis with angular coordinates to compute geographic distances among over 200 cities
- Created graphs with Matplotlib and Seaborn for data visualization, and designed geographic maps with GeoPython.
- Academic paper describing the project in detail
| First HSR in 2008 | HSR Network in 2018 |
|---|---|
 |
 |
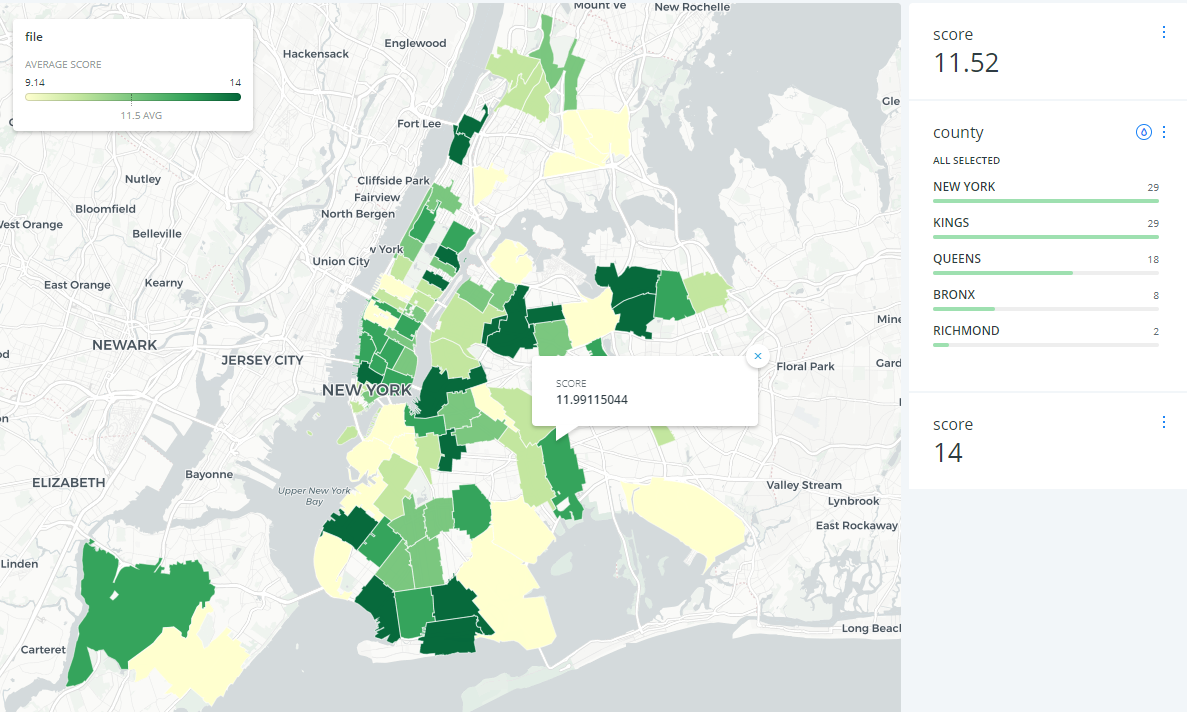
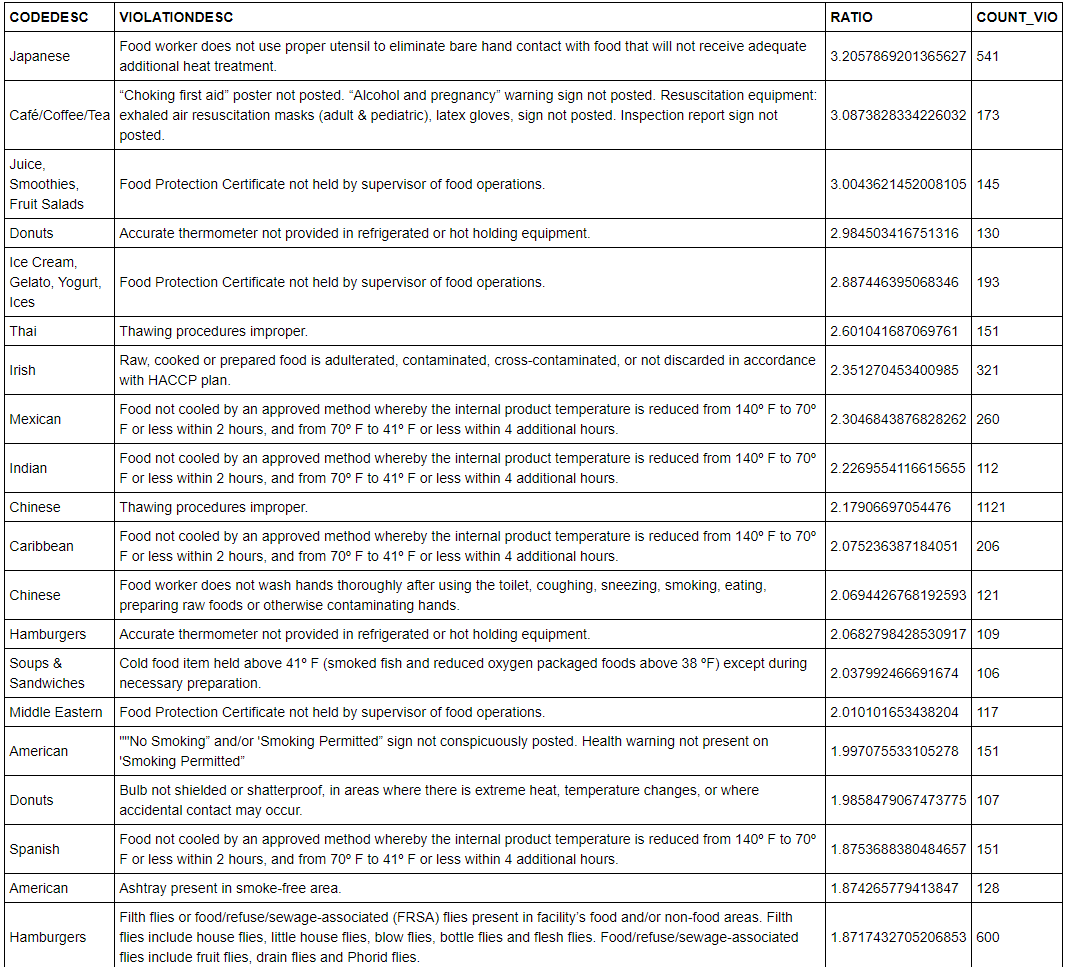
Analyzing restaurant inspection data using SQLite
This project utilized SQLite to clean and join four different datasets to conduct extensive analysis on New York restaurants’ health and safety scores, violations. Specifically, this project:
- removed the null entries grouping by restaurant and inspection date.
- checked the average inspection score for the most recent inspection by zipcode by merging datasets with certain conditions, and map it on Carto.
- calculated the average inspection score by different boroughs in New York.
- examined the violations by diverse cuisines to determine which cuisines tend to have a disproportionate number of what kind of violation. The right quantity to look at is the conditional probability of a specific type of violation given a particular type of cuisine. It is divided by the unconditional probability of the entire population’s violation.
Distributed Computation: Using Pyspark to Analyze Stack Overflow Posts
For a dataset as large as 10GB with stack overflow posts, using RDD, MapReduce, this project:
- filtered out the bad XMLs;
- aggregated posts by the number of favorite counts, and finds the average score for each number of favorites;
- for 99 users with the highest reputation, calculated these users answer percentage by calculating answers/(answers+questions), and the average answer percentage for all users;
- found the number of days between account creation and the first question for 100 users with the highest reputation;
- identified the veterans for users that have answered or asked questions between 100 and 150 days after account creation; defined the rest of the users’ brief users;
- presented the differences in average score, views, number of answers, and number of favorites between veterans and brief users and veterans have better stats for all measurements here Using PySpark DataFrame, this project:
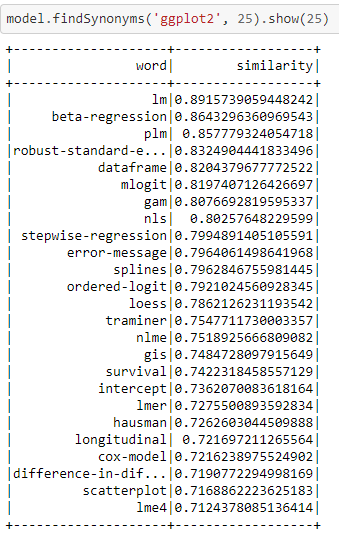
- applied word2vec as a vectorizer for text data, and finds the top 25 closest synonyms to ‘ggplot2’ and their similarity scores.
- built a machine learning pipeline, takes the body text as the features to predict whether a question contains one of the top ten most common tags
- removed stopwords, tokenized the texts, used HashingTF as the transformer, and logistic regression as the estimator; used cross-validation to tune hyperparameters.
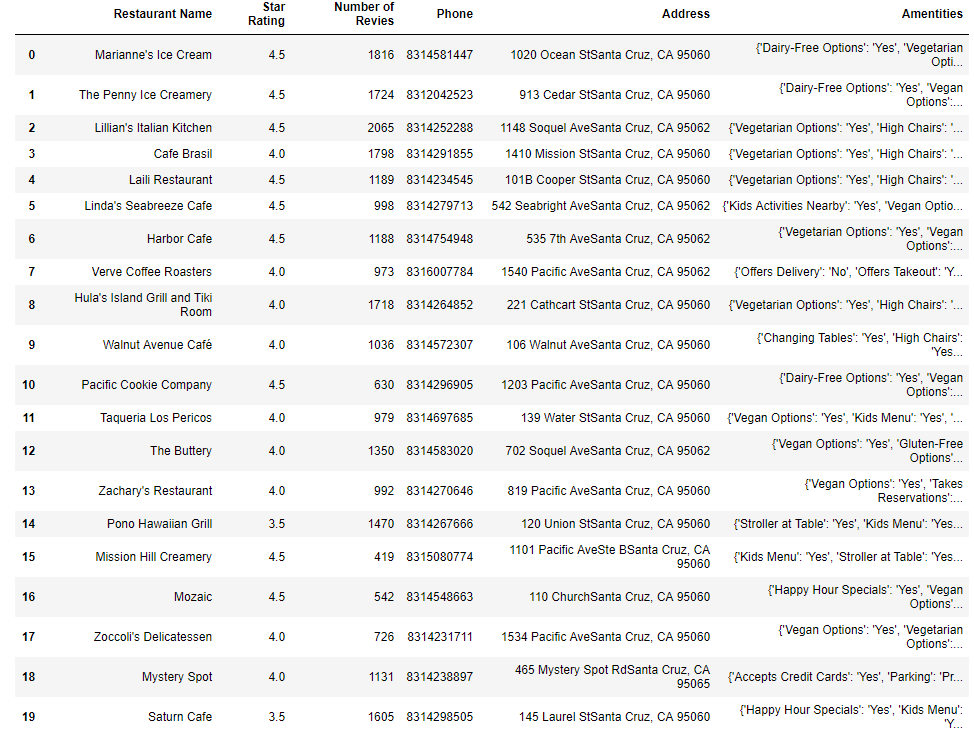
Star Rating Predictions with Machine Learning Models
- Utilized Yelp dataset to predict the star rating of new venues based on location, categories, and attributes.
- Built customized column selector, categorical variable encoder, a linear estimator with residuals fitting non-linear estimator.
- Built machine learning pipelines and constructed a full model combining three pipelines as a feature union. The full model reaches 95% accuracy in the test set.
Tweets Analysis and Visualizations with Twint and Pandas
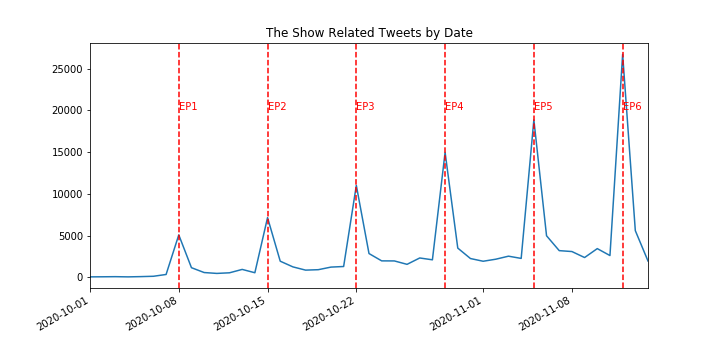
- Web scraped over 150000 related tweets from Twitter using Twint to analyze a Japanese TV Show’s popularity
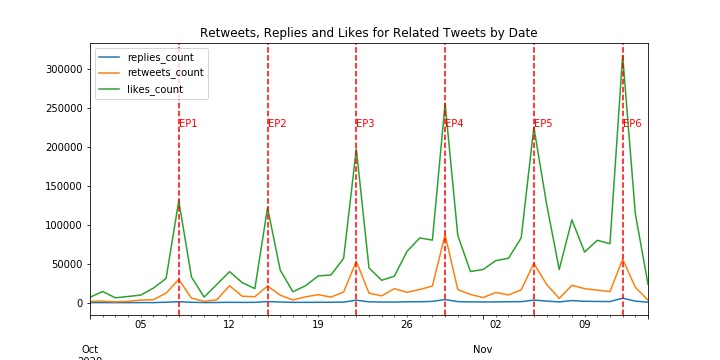
- Using Pandas to generate visualizations that tell the stories behind:
1, There are increasing trends in related tweets and users’ actions towards the tweets, seasoned around the show releasing date
| Tweets by Date | Tweets Actions by Date |
|---|---|
 |
 |
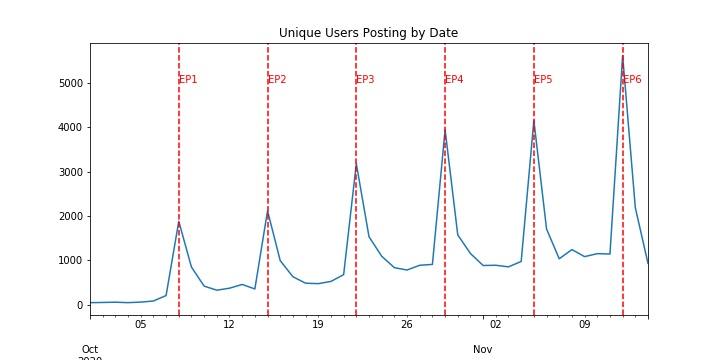
2, The increasing trend in tweets comes from the increasing number of unique users posting about the show, as well as the increasing number of posts from each user
| Unique Users by Date | Average User Posts by Date |
|---|---|
 |
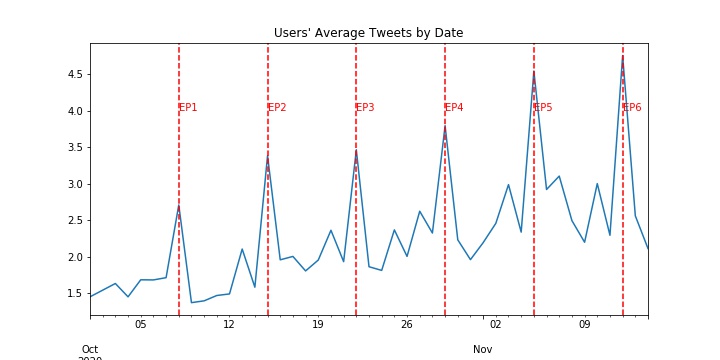 |
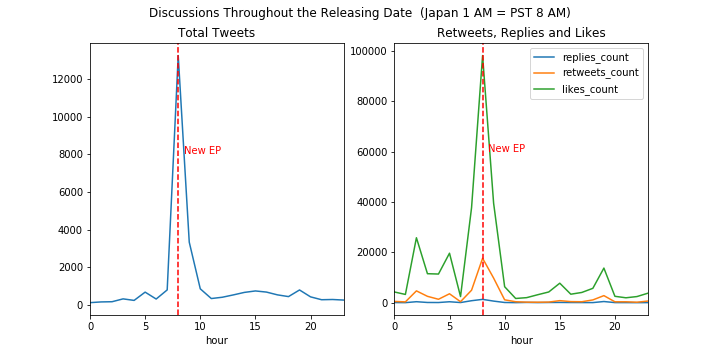
3, Users post about the show when the show is on air
4, The show is most popular in Thailand other than Japan
| Tweets by Hour | Tweets Languages Share |
|---|---|
 |
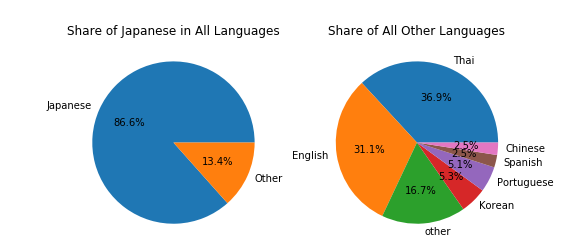 |
Image Classification with TensorFlow and Deep Learning Neutral Networks
This project uses TensorFlow and Deep Learning models to train and classify over 100,000 images into ten classes. Throughout the project, different models are presented to make better predictions step by step:
- treated image inputs as tensors and defined a delta function calculating the difference between the RGB components, and classify the image to the class with the smallest RGB difference;
- generated a typical image that minimizes the RGB difference to all training images for each class using gradient descent, and only compared images in the test set to typical images for each class;
- customized a logistic regression model to make multi-class classifications using softmax model;
- built a multi-layer fully-connected neural network that takes the pixel values as input and yields a class prediction as output;
- built a neural network with two convolutional layers, two fully-connected layers with AdamOptimizer;
- loaded a pre-trained interception network model, transformed all train and test images into latent vectors, and made predictions a fully-connected neural network model based on the latent vectors.
Time Series Analysis: Predicting Temperature in Different Cities
This project read historical temperature for each city from a txt file, and used two models to predict the temperature using time series techniques:
- built a group-by estimator that takes an estimator factory. The estimator factory is a collection of estimators for each city. In this case, each city’s estimator is only fitting into its data and make corresponding predictions. The first model uses Random Forest models to predict each city’s temperature.
- used is a Fourier model that captures the seasonal features. Using month and hour, the group estimator is making better predictions for each city.
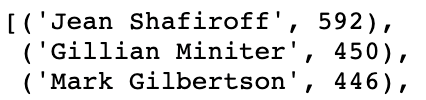
New York Elite Social Network
- Web scraped over 100,000 photo captions from New York Social Diary and extracted names using Regex and spaCy.
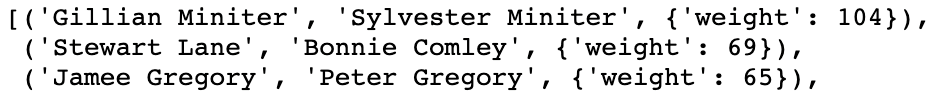
- Built New York Elite social network using Networkx with the assumption that people in the same picture know each other.
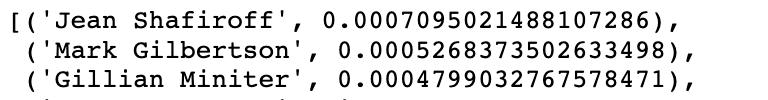
- Utilized the New York elite social network to find the most famous socialites, most influential people, and the most tightly coupled pairs.
| Most Influential(Degrees) | Most Influential (PageRank) | Most tightly coupled |
|---|---|---|
 |
 |
 |
Text Analysis on Yelp Reviews
This project used NLP and machine learning models to predict Yelp star ratings based on text reviews:
- used Hash Vectorizer and TFIDF Vectorizer including bigrams as the transformer, and used Ridge regression.
- used GridSearchCV to find the best parameters for both the transformer and the estimator.
- utilized the Counter Vectorizer to find the 100 most common food bigrams, by calculating p(w_1w_2)/p(w_1) * p(w_2)
Web Scraping Demo: Using Yelp as an example
I taught graduate students how to web scrape using Yelp as an example:
- demonstrated the use of web scraping on how to get information from the source page
- wrote functions to scrape different information neatly